Search Fund Performance Comparison
Comparing search-fund returns to PE, VC, the S&P 500 and the Brazilian CDB — and why the asset class is hard to overlook.
Before deciding on starting a Search Fund we did some basic comparison of asset class performance, mainly for our own purposes, and we would like to share the results here. The data is publicly available and just needs to be pulled together as we did it in the table below.
We would like to remark that the comparison needs to be handled with care for various reasons:
- Average returns for all the examined asset classes vary over time. We try to reflect an average over the last 10 to 15 years.
- There are a lot of sources for this kind of data, and they are not all necessarily equal; so we needed to average over several of them — however this approach seems fair to us since there were no outliers with > 10% variation.
- IRR is a relative metric as it does not provide any information on the timing of the cash flows. This means the metric assumes that payouts during the investment cycle could be immediately re-allocated into assets that perform with the same rate of return. This is, however, hardly realistic when dealing with IRRs as high as in the search-fund asset class, as there are no other asset classes you could re-apply the payouts to.
- The comparison to a Brazilian CDB in the end must be interpreted with care since the return is in a different currency with a higher inflation and would need to be adjusted before comparing. Also, the risk profile is of course completely different (with basically zero volatility). Still, we thought it is helpful for Brazilian investors to also provide this comparison, since “Safe returns from CDB” is the argument we mostly heard when pitching startups to Brazilian investors. The argument makes sense when comparing to VC/Startup investments, however it does get less persuasive in the comparison to the opportunity to invest in a search fund.
| Asset Class | Average IRR | Top Quartile IRR | Average Multiple |
|---|---|---|---|
| US Private Equity | 13.7% | 36.5% | 1.4x |
| US Venture Capital | 8% | 20% | 1.31x |
| US & Canada Search Fund (Stanford 2024) | 35.1% | NA | 4.5x |
| International Search Fund (IESE 2024) | 18.1% | NA | 2.0x |
| S&P 500 | 8% | NA | NA |
| Brazilian CDB | 12% | NA | NA |
A note on the international IRR. The Stanford and IESE numbers should not be read as a head-to-head comparison. They are snapshots of two cohorts at very different points in their J-curves. Stanford’s data covers four decades of US and Canadian search funds, with the bulk of returns coming from realised exits. IESE’s international cohort is markedly younger — 62% of all international acquisitions have happened since 2020 and remain in the early operating years, well ahead of the four-to-eight-year value-creation window that drives search-fund returns. As that cohort matures and exits accumulate, the international aggregate IRR is expected to converge upward, mirroring what US data did fifteen years ago. 2023 was a record year for new international fund formation — a leading indicator of where the asset class is heading.
Although relatively unknown and without a doubt risky, considering the IRR it can be said that Search Funds are an asset class that cannot be afforded to be overlooked.
We think Search Funds are especially interesting for investors who want to invest smaller tickets in a high-performing asset class — investors who do not have the opportunity to invest as a Limited Partner in a Private Equity Fund but still would like to enjoy similar (in fact, much better) returns; investors who can afford to only allocate small amounts of capital per investment but who are not satisfied with the highly volatile and lower-return profile of startup investments.
Investors should be aware of the very high volatility and risk behind search funds, however. The 2024 Stanford GSB study, the most recent edition of the asset-class data, summarizes:
- 681 first-time search funds raised in the US and Canada since 1984, of which 296 acquired companies are included in the financial analysis.
- Aggregate IRR of 35.1% and ROI of 4.5x as of December 31, 2023 — down from 5.2x ROI in the 2022 study, partly due to a younger cohort of acquisitions and partly due to higher interest rates compressing recent valuations.
- IRR for search funds that have already exited rose to 42.9%, up from 36.8% in the 2022 study, reflecting strong realisations in 2022–23.
- 2023 was a record year for fund formation, with 94 core search funds launched.
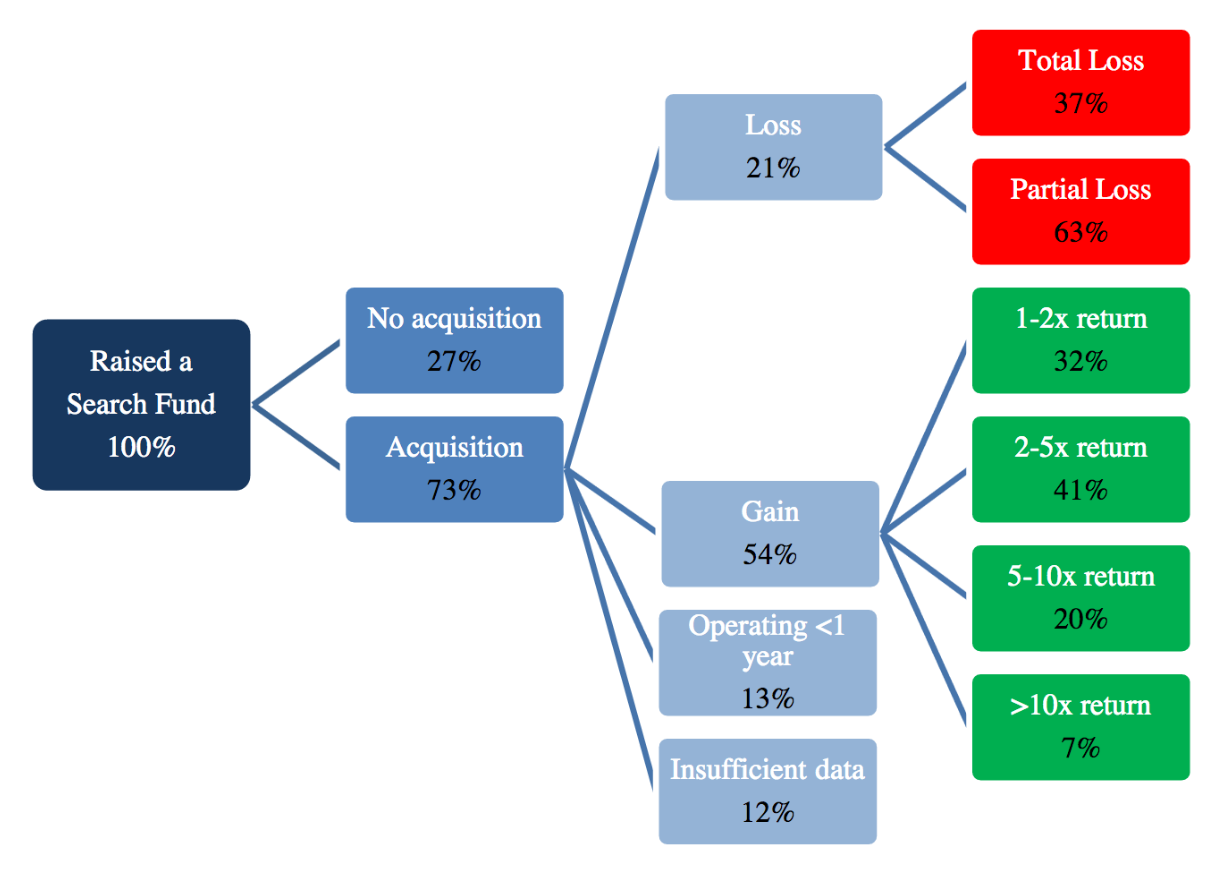
- The performance of individual search funds varies widely — from greater than 10x ROI for highly successful companies to total loss of capital. Distribution by IRR ranges from greater than 100% to negative.
The aggregate IRR of all first-time search funds has historically fluctuated between 32% and 38% since the 2001 study, with the exception of the 2007 study (52% IRR) and the 2024 update at 35.1%.
The following picture provides a better understanding of potential outcomes and distribution of such outcomes over a sample of search funds in the US:
Although the average performance of US as well as international search funds is strongly influenced by the top-performing funds, the average IRR still remains considerably higher than any other asset class we compared the search-fund model to. The 2024 IESE international study makes the cohort effect explicit: 62% of all international acquisitions to date occurred after 2020 and remain in their early operating years, mechanically depressing aggregate IRR until those companies accumulate exits.